 Chapter 6 - Sample images Chapter 6 - Sample images
 Example 1: Immune-stained mouse embryo (light sheet)
Example 2: Multi-stained mouse embryo (light sheet)
Example 3: GFP-expressing neocortex of a mouse (light sheet)
Example 4: GFP-expressing neurons in the neocortex of a mouse (confocal microscopy)
Example 5: Double-stained neurons in a mouse hippocampus (light sheet)
Example 6: Faceted eye of a fruit fly (confocal microscopy)
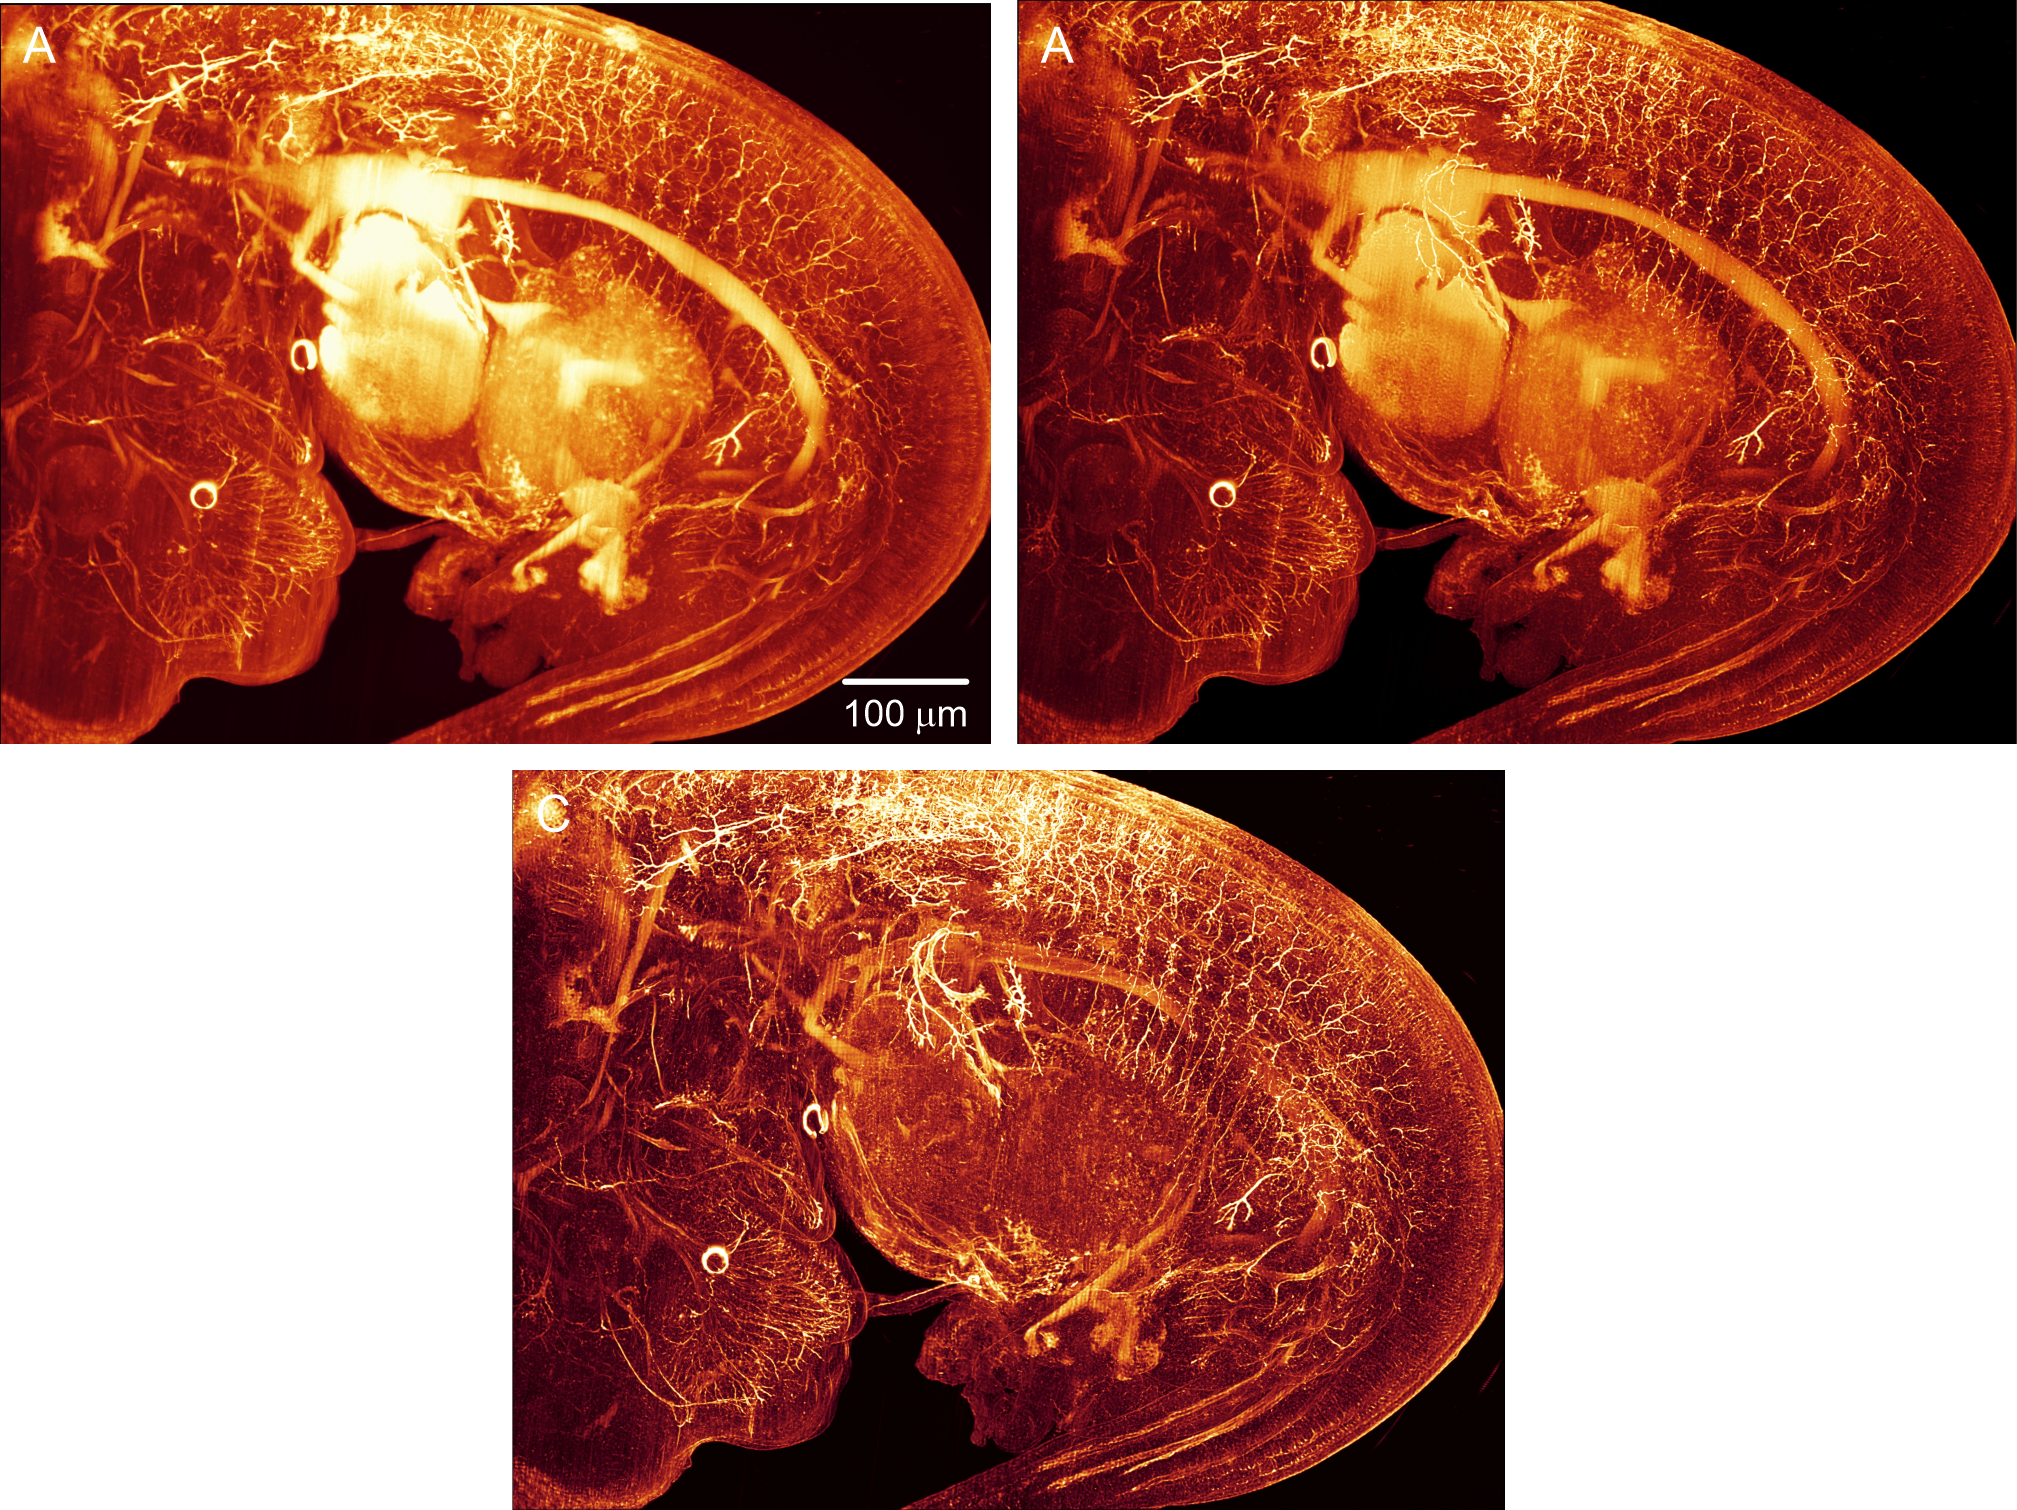
Figure 6.1 3D reconstructions (MIP projection) of an immune-stained and chemically cleared E12.5 mouse embryo. Nerve fibers are highlighted by NF-160 fluorescence labeling. Recording was performed using a light sheet microscope equipped with a cylindrical lens of 80 mm focal length and a 6 mm wide slit aperture (Objective Zeiss FLUAR 2.5x, NA 0.12, 0.5x post magnification). A) Raw data: Reconstructions were obtained from 668 slices, each with a resolution of 1392 x 1040 pixels, recorded using a Cool Snap Cf CCD camera (Roper Scientific, Germany). The illumination time was 430 ms. B) Deconvolution done without background subtraction: Deconvolution parameters: NA = 0.12, excitation wavelength = 488 nm, emission wavelength = 520 nm, n = 1.561, light sheet NA = 0.05, stop criterion = 0.5%, max. iterations = 100, histogram clipping = 0.01, no damping. The required processing time was under 5 minutes on a 16-core workstation with 256 GB RAM and an NVIDIA P6000 graphic processor card (GPU-deconvolution mode). C) Deconvolution using rolling ball background subtraction: Same as B) but with rolling ball background subtraction (75 µm filter radius) performed prior to deconvolution.
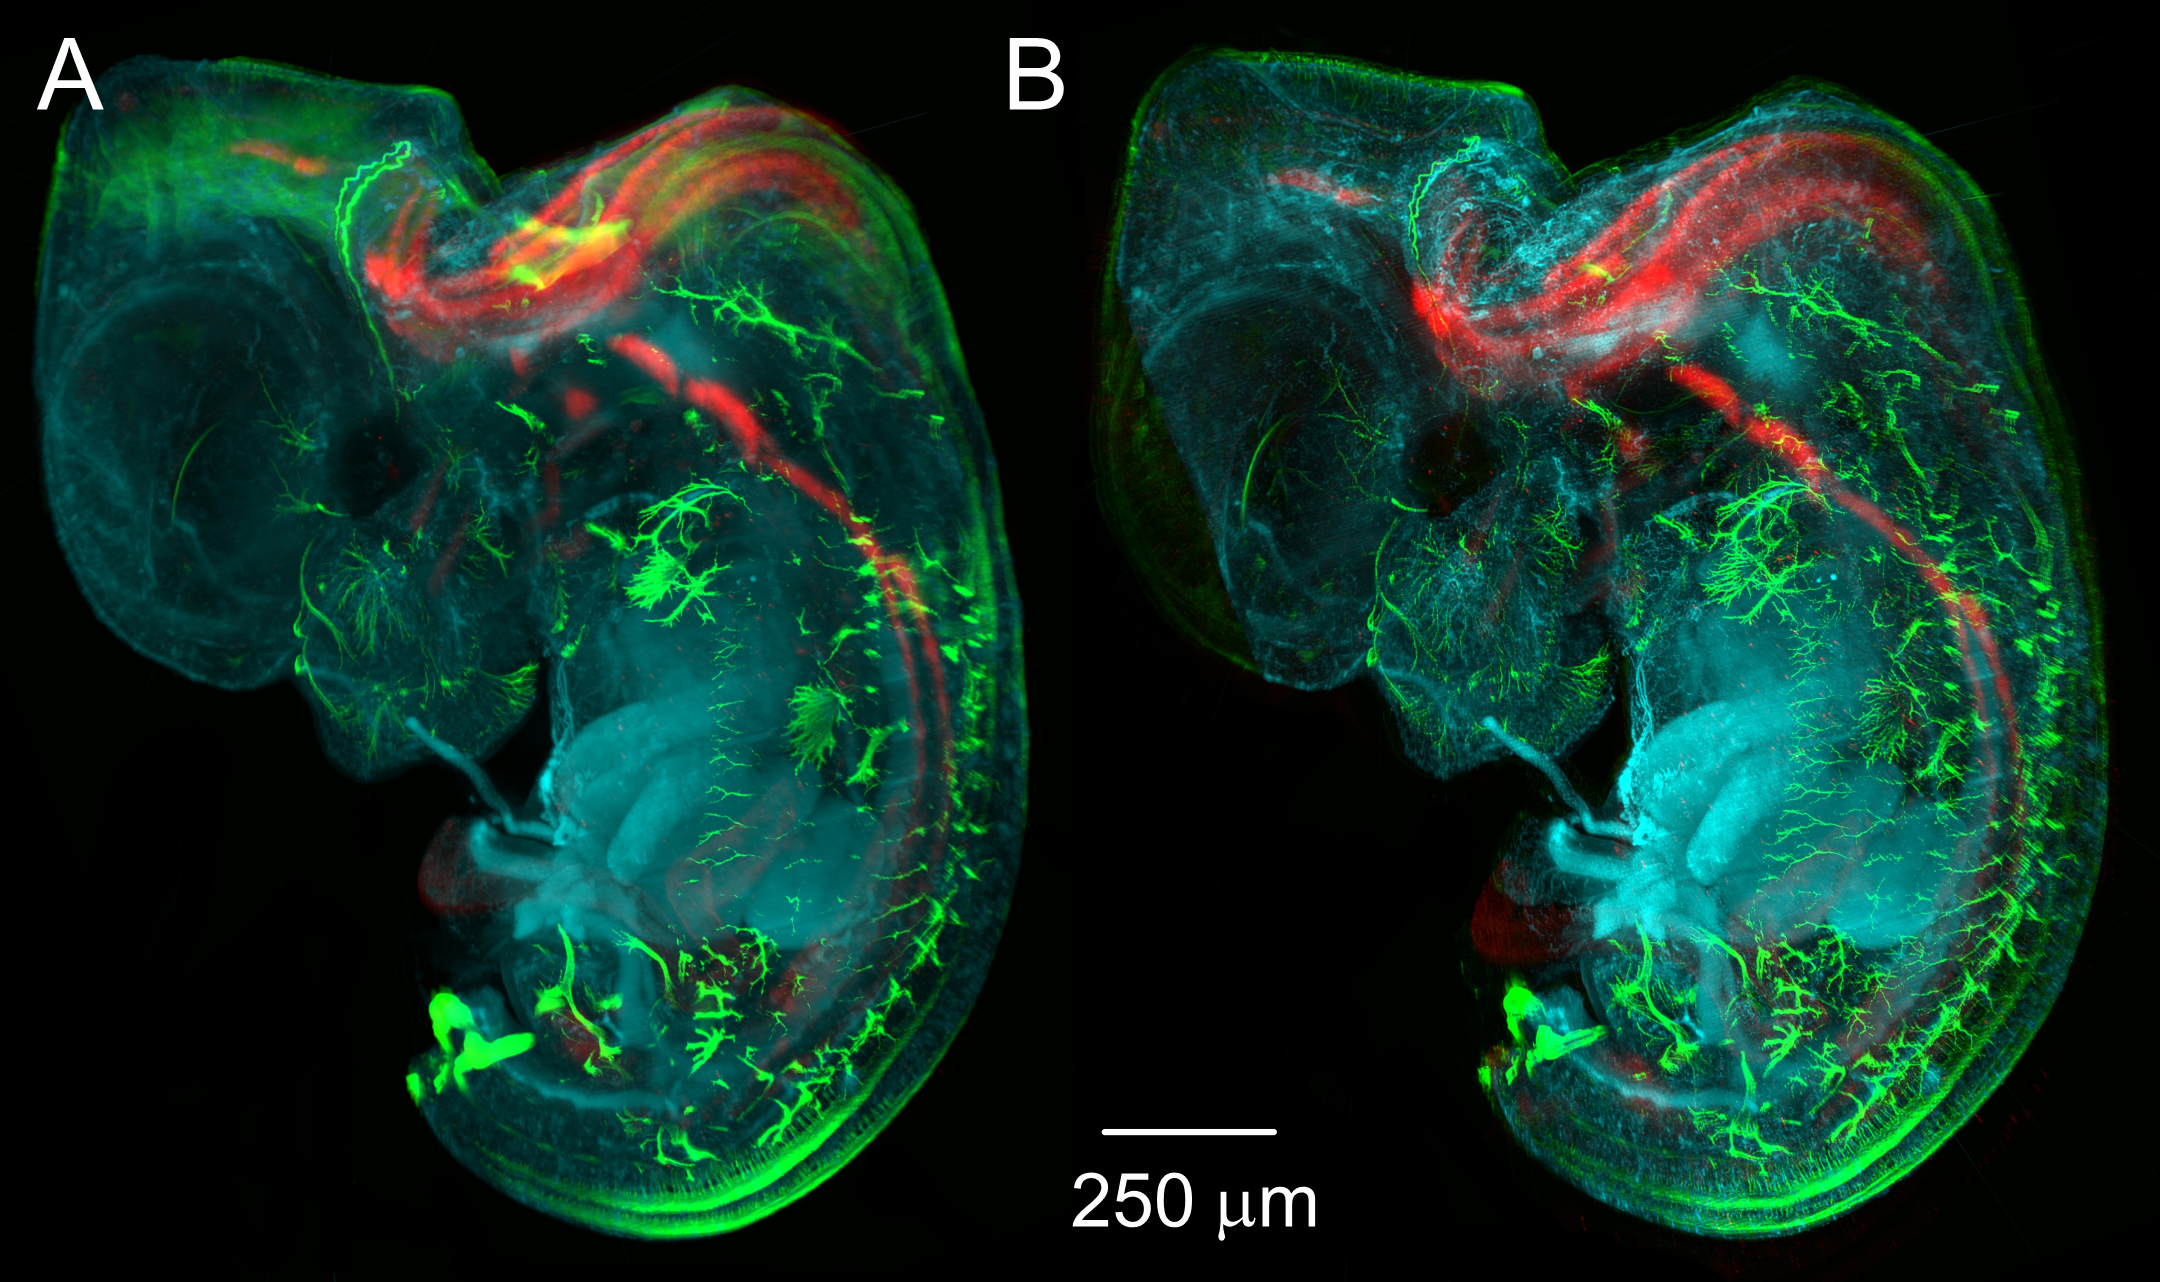
Figure 6.2 3D reconstructions (MIP projection) of a chemically cleared mouse embryo, multi-stained with three different fluorescent dyes. (GFP: excitation wavelength = 488 nm, 2H3: excitation wavelength = 550 nm, Phox2B: excitation wavelength = 647 nm). Recording was performed using a light sheet microscope equipped with a light sheet generator of high Rayleigh range (NA = 0.05) (Objective Olympus XL FLUOR 4x, NA 0.28, 0.63x post magnification). A) MIP obtained from the raw data: Reconstructions were obtained from 600 slices, each with a resolution of 2560 x 2160 pixels, recorded with an AndorNeo CCD camera (Oxford Instruments, Germany). B) MIP projection obtained from the deconvolved data: Deconvolution parameters: NA = 0.28, excitation wavelengths = {488 nm, 550 nm, 647 nm}, emission wavelengths = {520 nm, 570 nm, 695 nm}, n = 1.561, light sheet NA = 0.05, stop criterion = 0.5%, max. iterations = 100, histogram clipping = 0.01, no regularization, rolling ball filter radius = 40 microns.
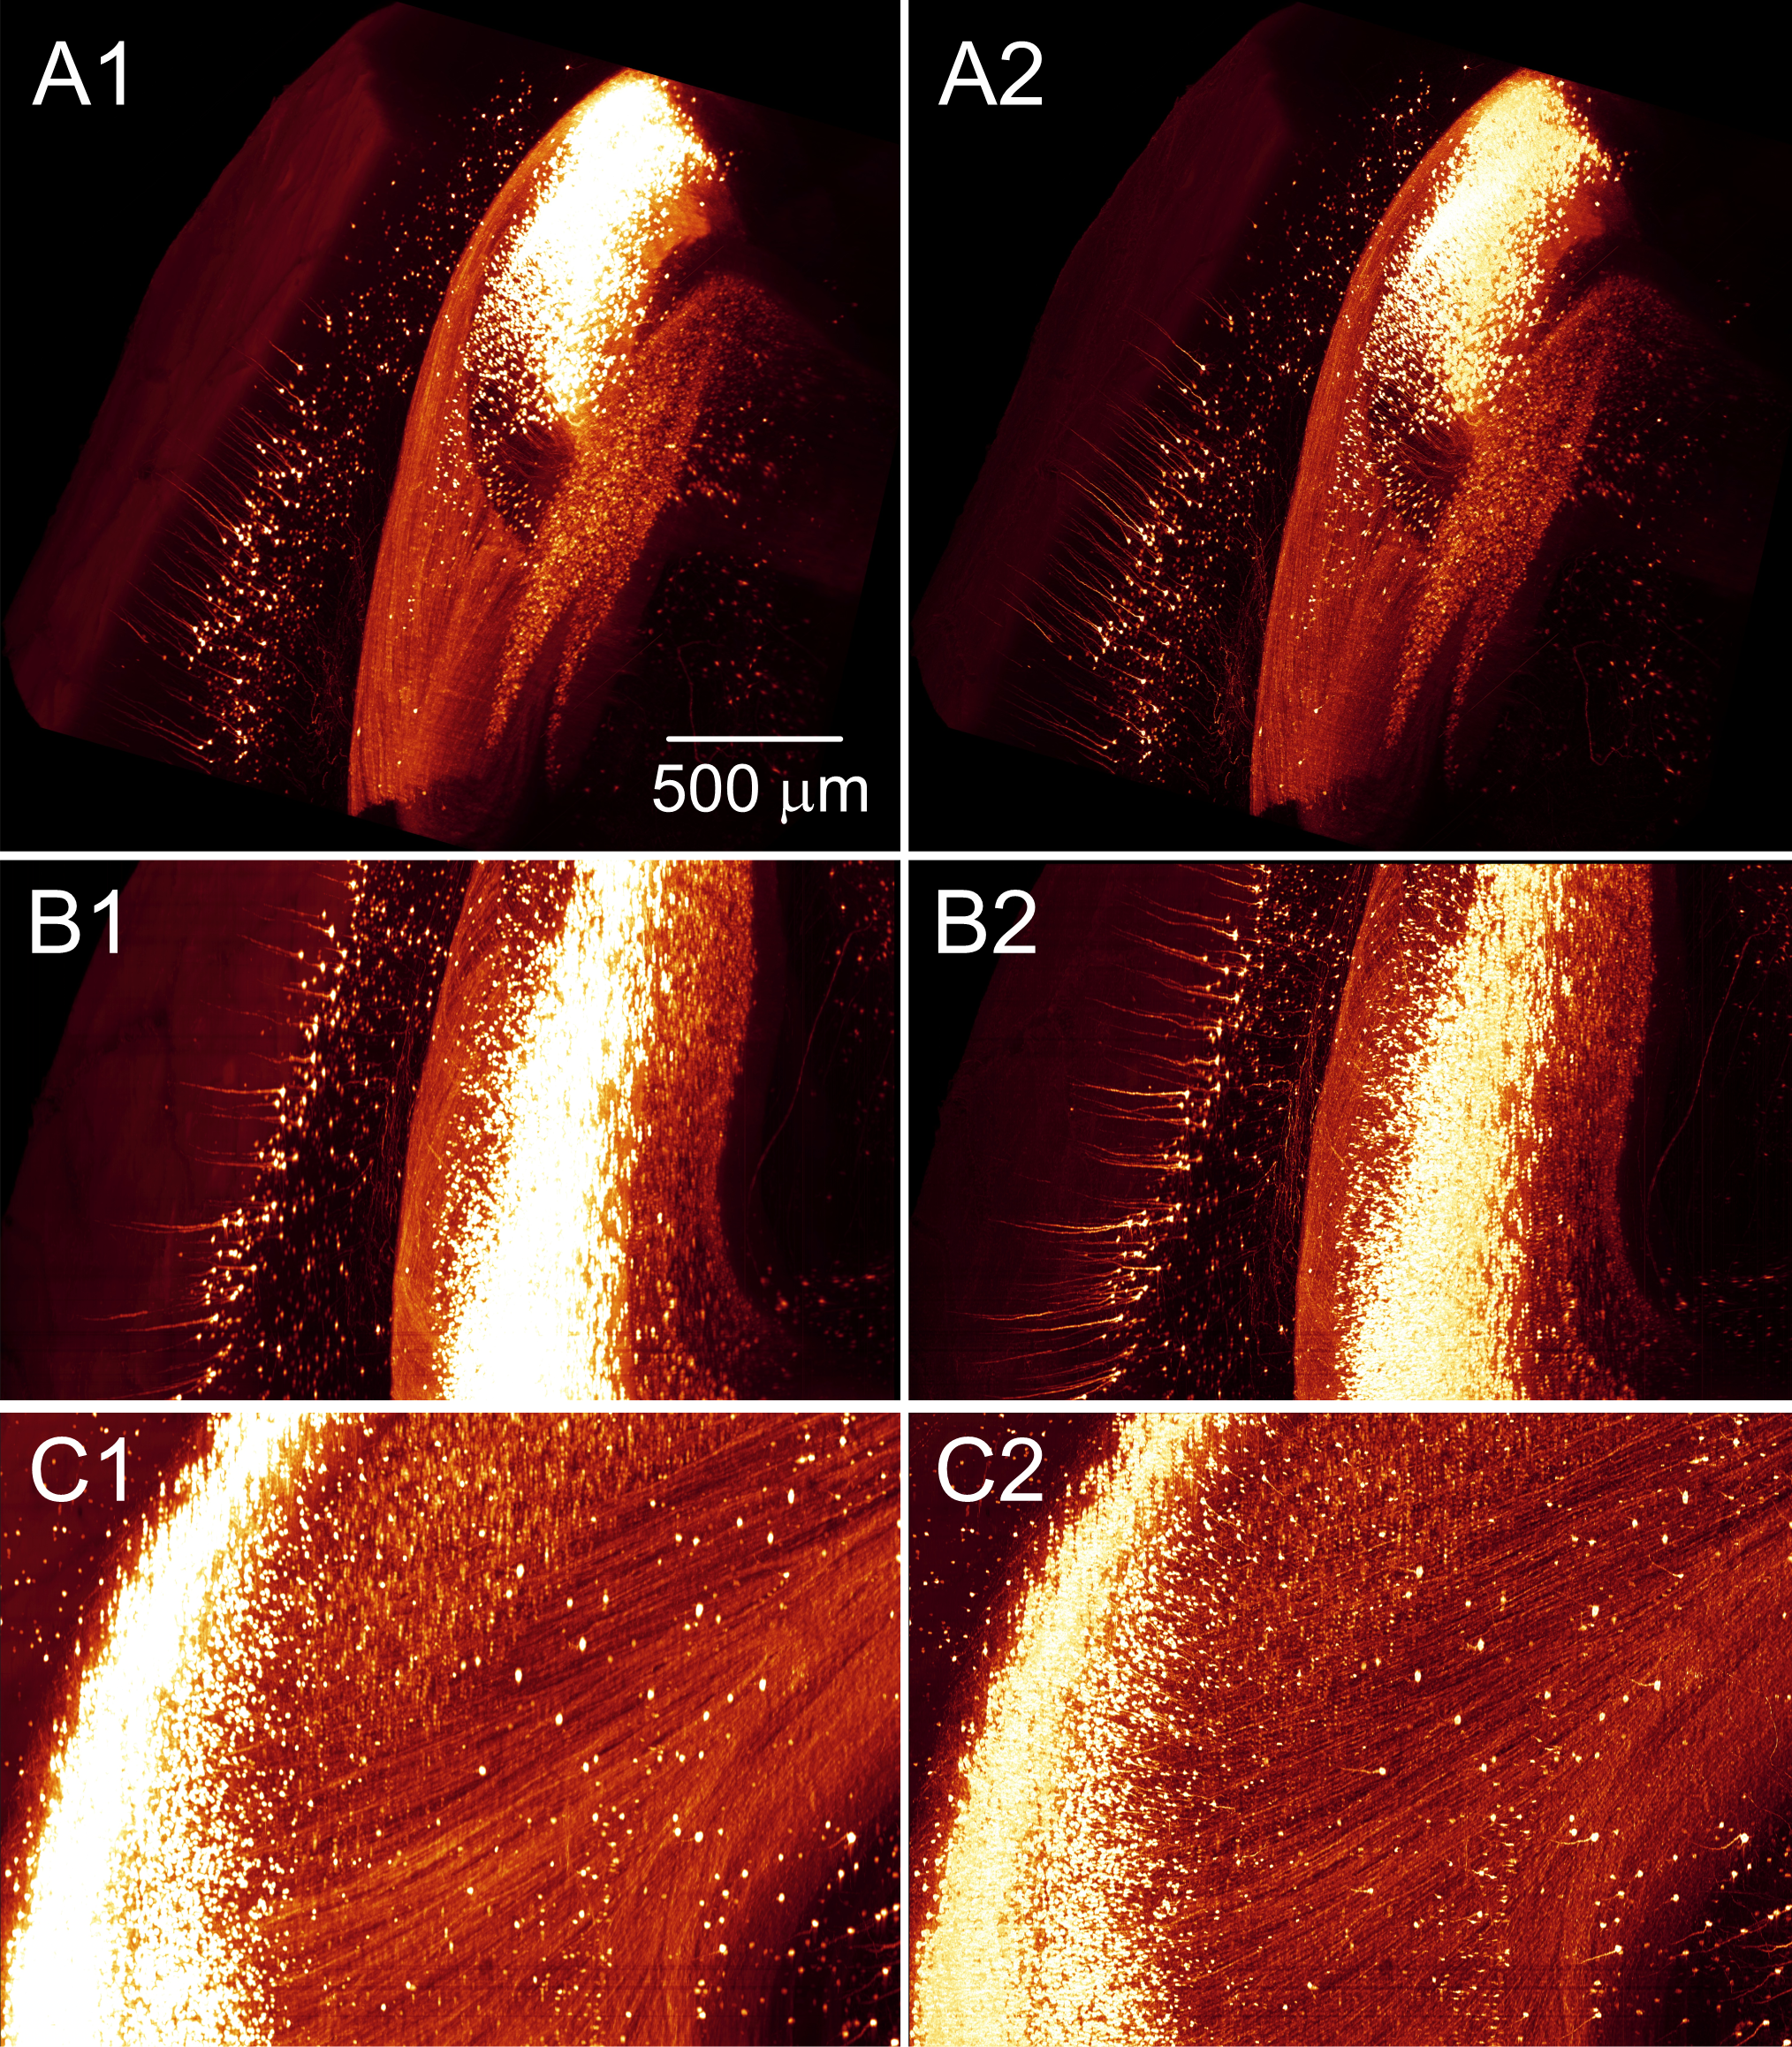
Figure 6.3 Cortical neurons recorded in an entire chemically cleared mouse brain. Recording was performed using a light sheet microscope with a light sheet generator of high Rayleigh range (NA = 0.05) (Objective Olympus XL FLUOR 4x, NA 0.28, 2x post magnification). A) Raw data: MIP obtained from 777 slices, each with a resolution of 2560 x 2160 pixels, recorded with an AndorNeo CCD camera (Oxford Instruments, Germany). B) Deconvolved data: Deconvolution parameters: NA = 0.28, excitation wavelength = 488 nm, emission wavelength = 520 nm, n = 1.561, light sheet NA = 0.05, stop criterion = 0.5%, max. iterations = 100, histogram clipping = 0.01, no regularization, no background subtraction.
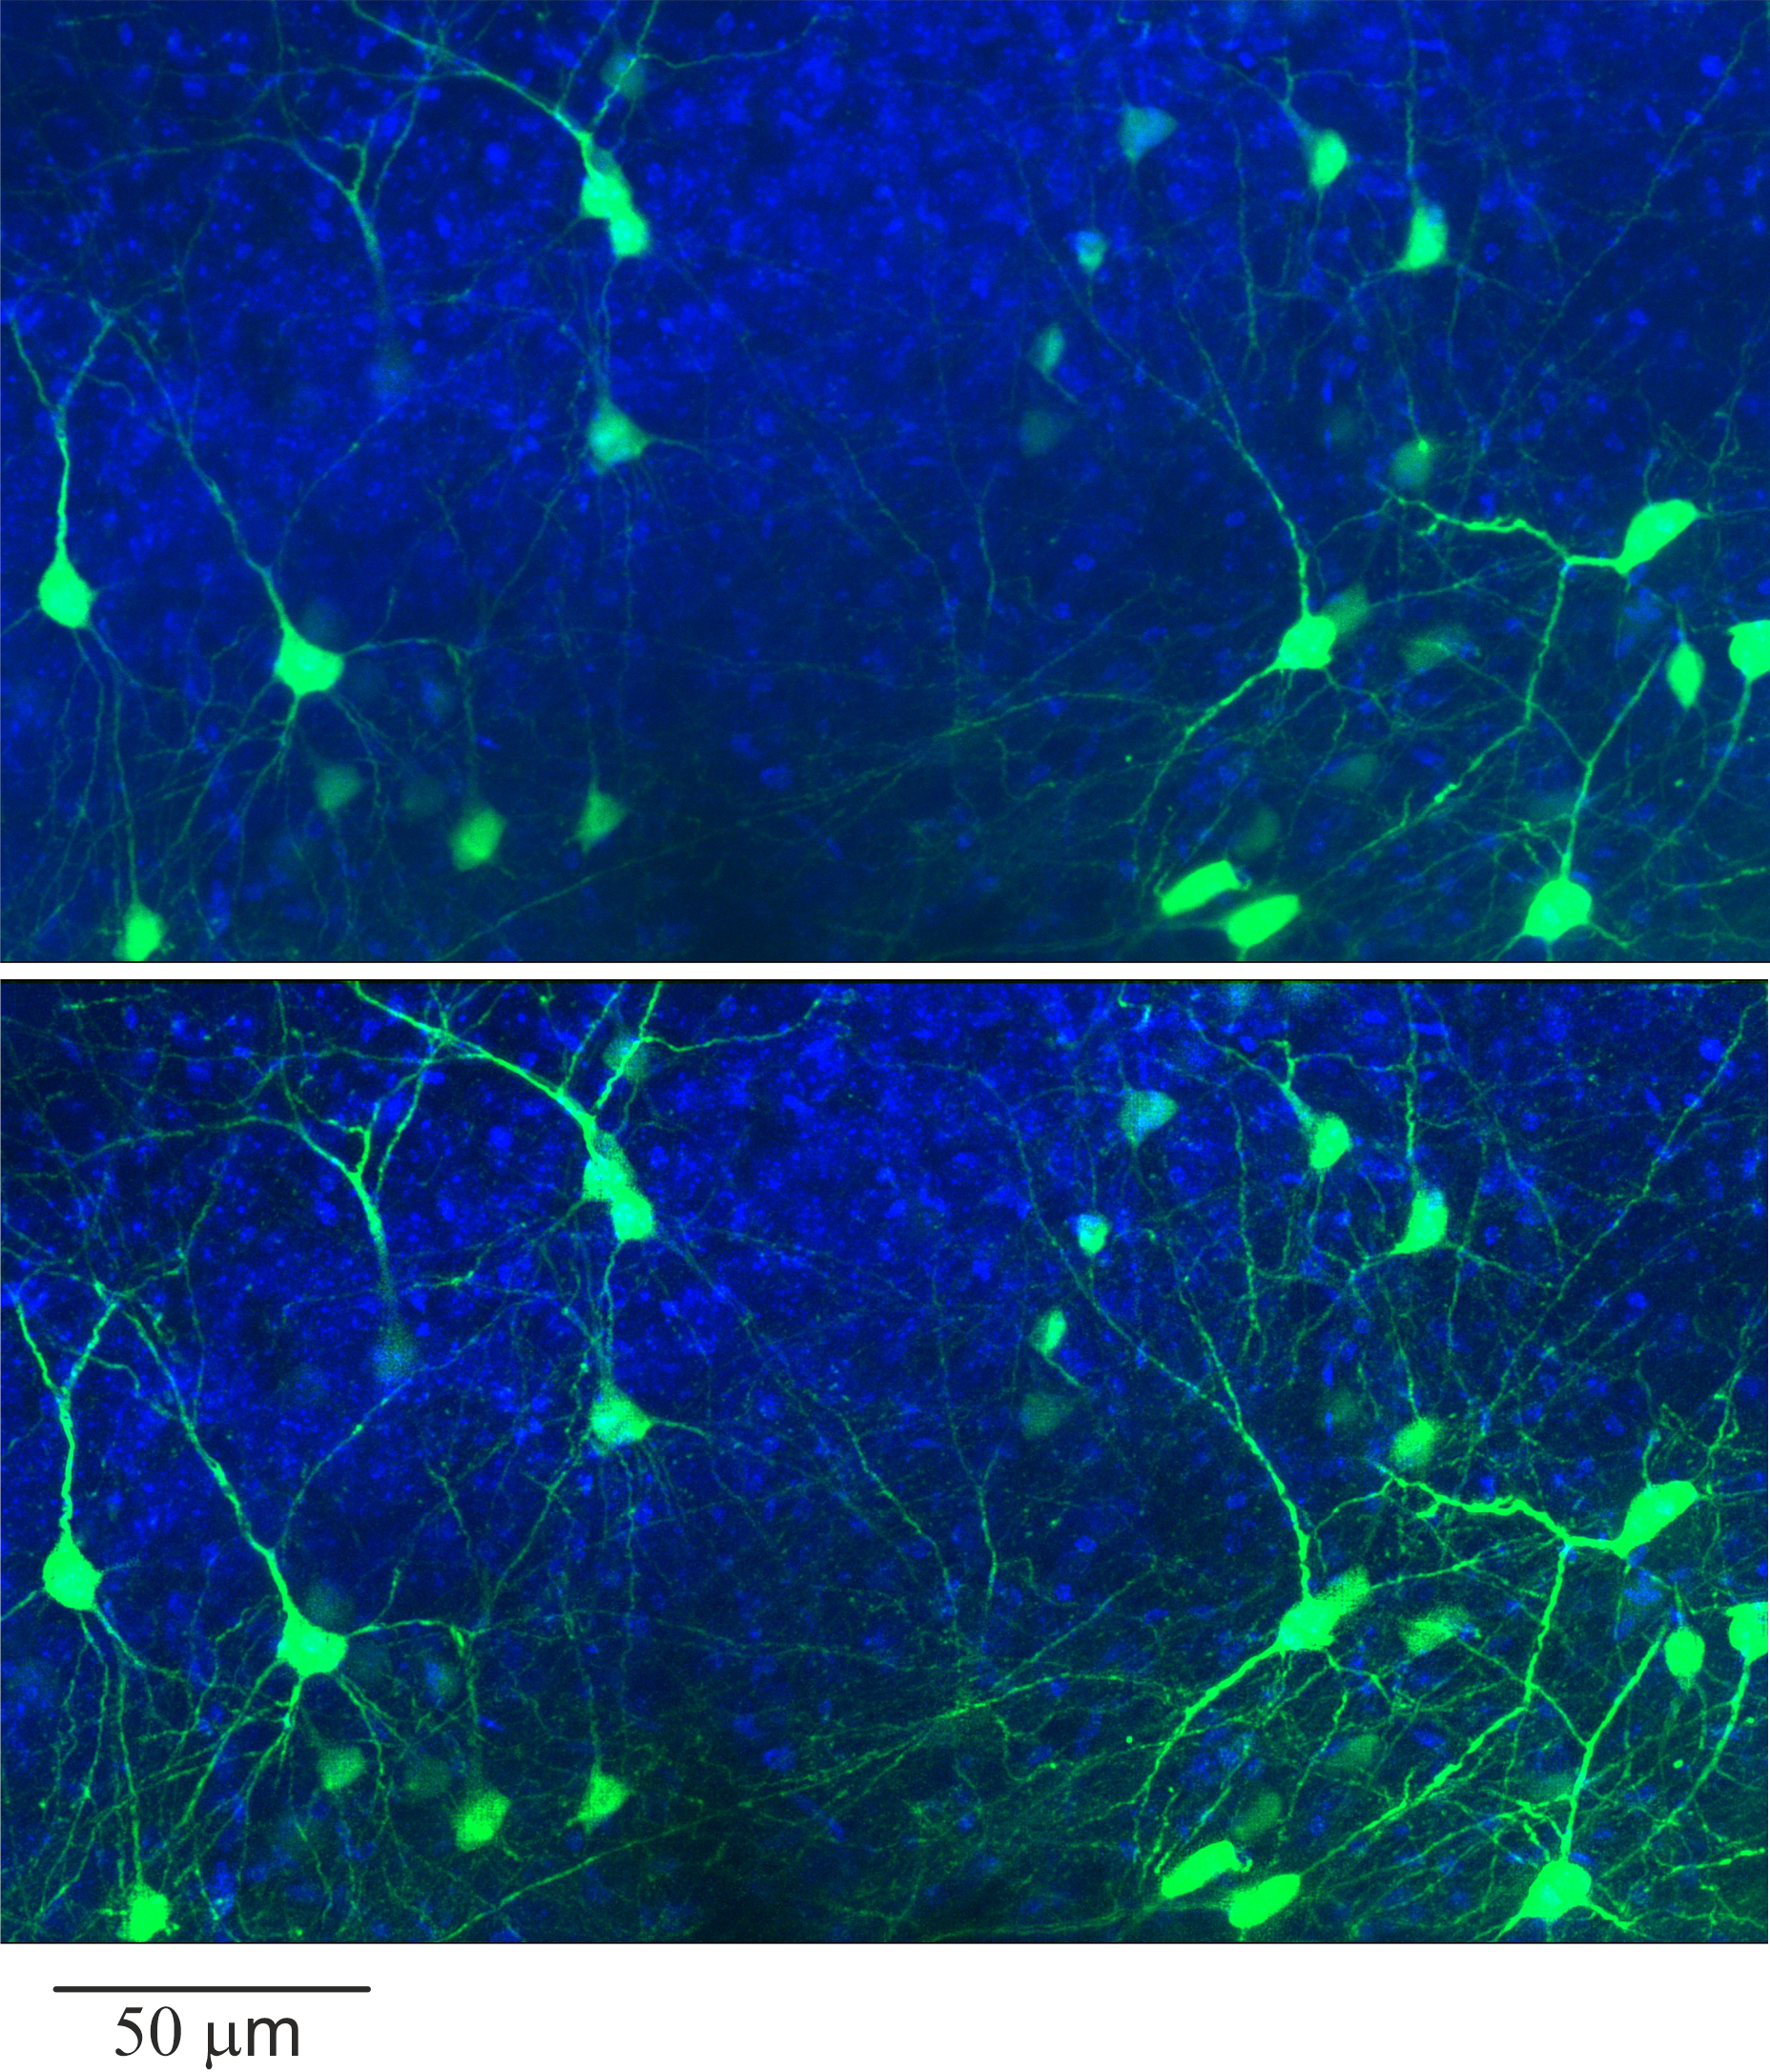
Figure 6.4 Neurons in the cerebral cortex of a mouse recorded by confocal microscopy. (Objective Zeiss 60x, NA 0.8), excitation wavelength = 488 nm, emission wavelength = 520 nm, n = 1.45. A) Raw data: MIP obtained from 117 slices. B) Deconvolved data: Deconvolution parameters: NA = 0.8, excitation wavelength = 488 nm, emission wavelength = 520 nm, n = 1.45, pinhole diameter = 30 microns, stop criterion = 0.1%, max. iterations = 100, histogram clipping = 0.01, regularization = 40%, rolling ball filter radius = 2 microns.
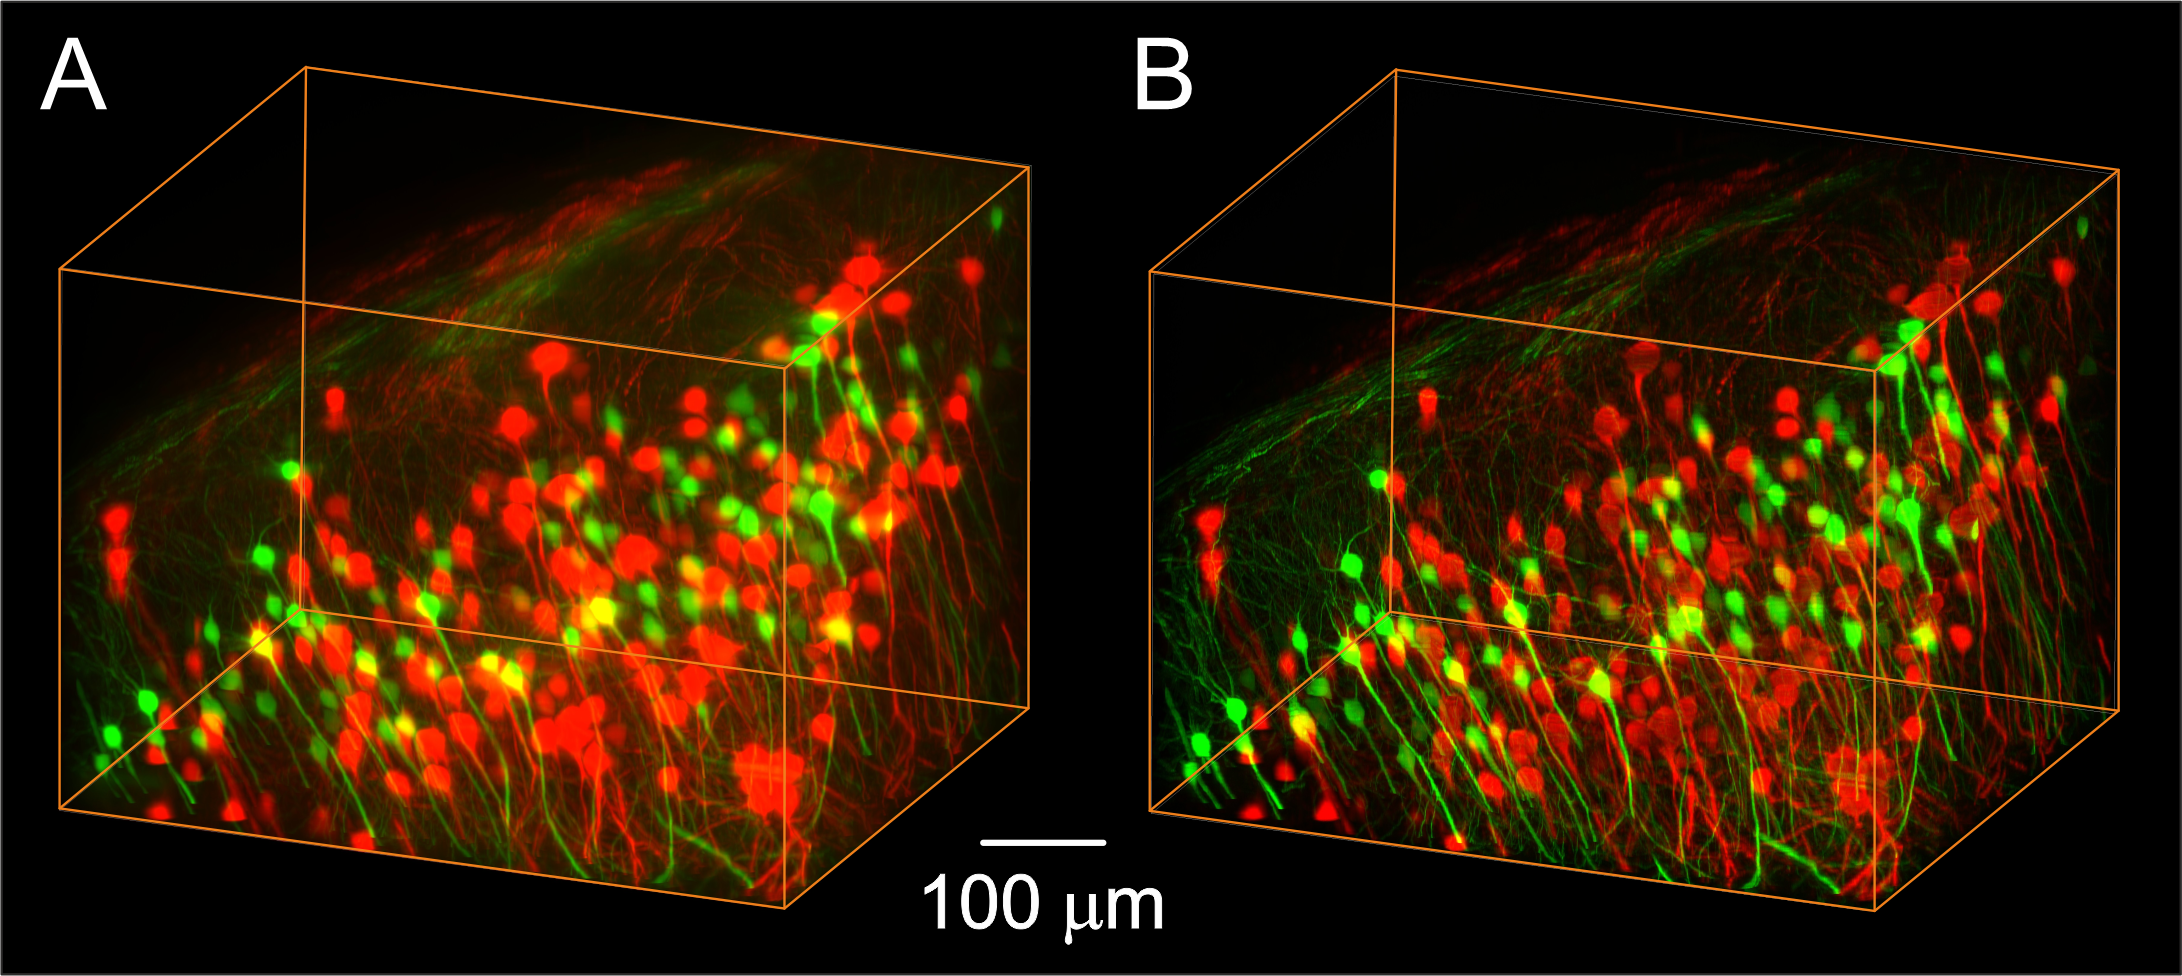
Figure 6.5 Double-staining of neurons in the hippocampus of a mouse.
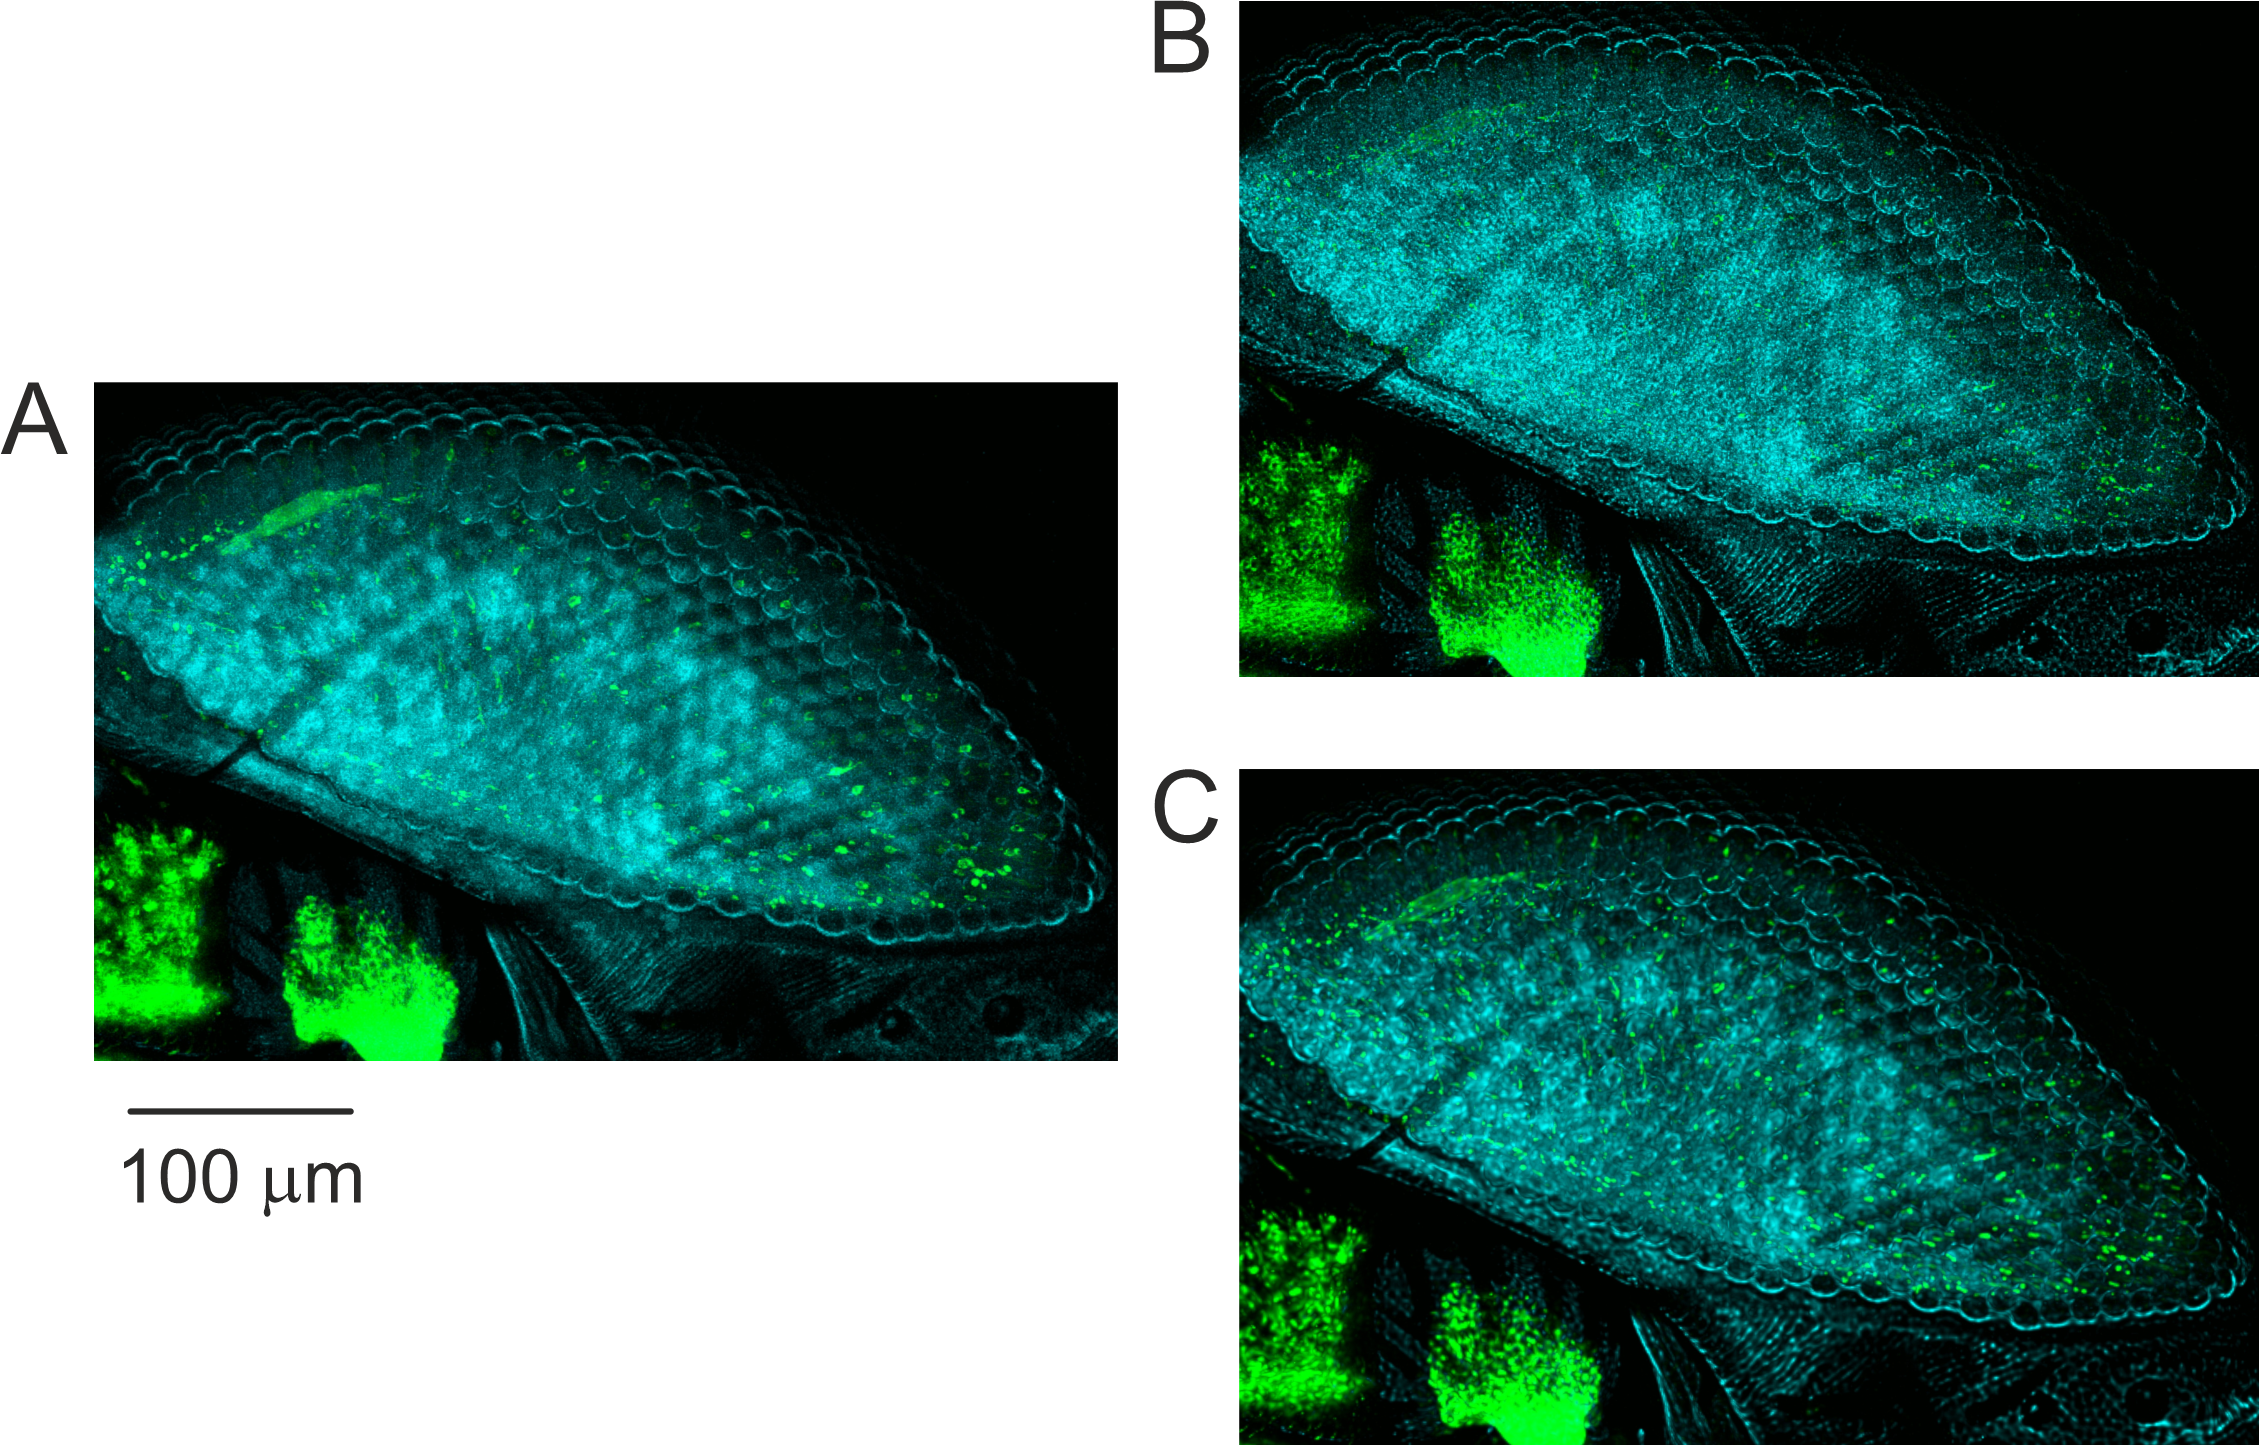
Figure 6.6 Faceted eye of a Drosophila melanogaster (fruit fly) recorded by confocal microscopy. (Objective Olympus UPLANFL 40x, NA 0.75), excitation wavelength = 488 nm, emission wavelength = 520 nm, n = 1.33. A) Raw data: MIP obtained from 64 slices. em> B) Deconvolved data: Deconvolution parameters: NA = 0.75, excitation wavelength = 488 nm, emission wavelength = 520 nm, n = 1.33, pinhole diameter = 30 microns, stop criterion = 0.1%, max. iterations = 100, histogram clipping = 0.01, regularization = 30%, rolling ball filter radius = 1 micron.